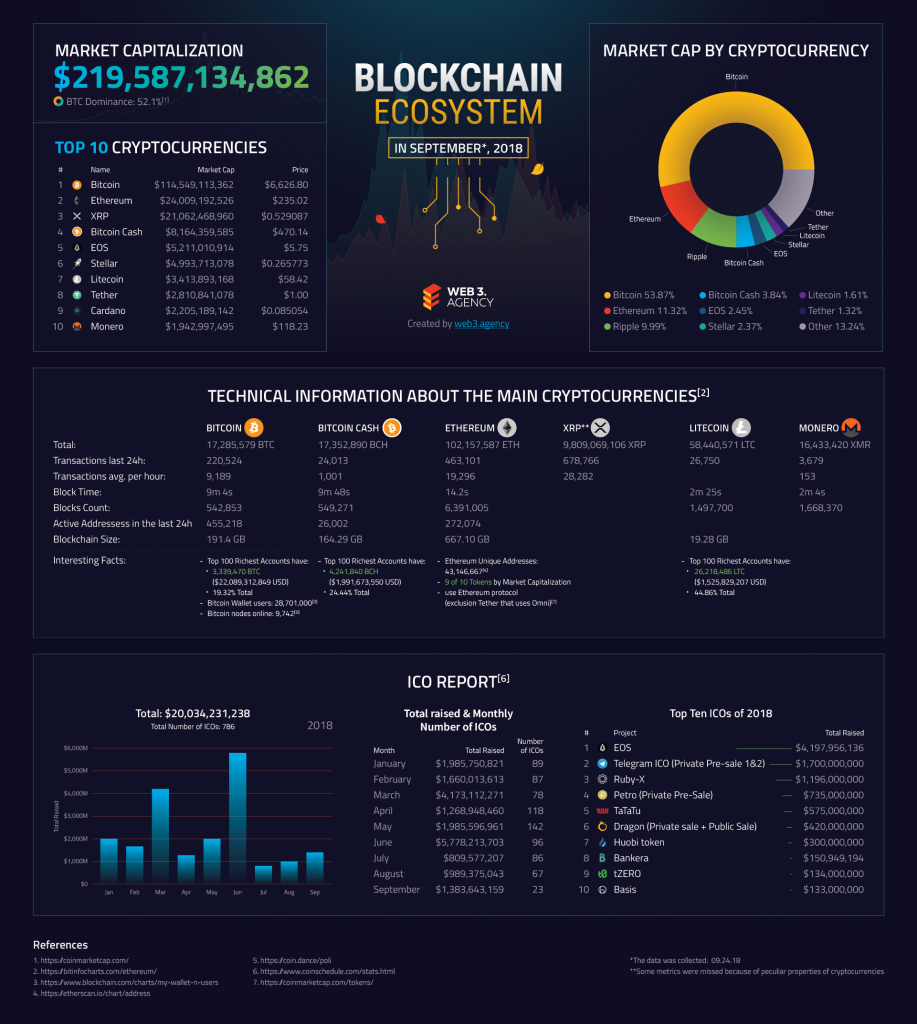
[Infographic]: The current status of the Blockchain Ecosystem, September, 2018
October 1, 2018 by Leo Webb
12643
No Comments

We decided to set up a tradition and publish different useful infographics about the blockchain ecosystem. We’ve asked our partners from web3.agency to prepare a first infographic and we are happy to share it with you.
Short summary of the presented data:
- Bitcoin is continue to have a half of the market capitalization: 52%
What is making for improving the scalability of Bitcoin
- Top 100 Richest Accounts have: 3,339,470 BTC ($22,089,312,849 USD) or 19.32% Total Bitcoin supply. In comparison, Top 100 Richest Bitcoin Cash accounts has 24.44% of total supply. However, the most centralized is Litecoin: Top 100 Richest Accounts have: 26,218,486 LTC ($1,525,829,207 USD) 44.86% Total. We can see, that majority of tokens belongs to centralized exchanges: Binance, Bitfinex, etc. This increase threats of the market manipulations and we shouldn’t consider these cryptocurrencies to be truly decentralized.
- In accordance with blockchain.info, now we have 28 701 000 Bitcoin Wallet users, that number was increased in two times in comparison with the previous year. So, despite the fact of having a great hype around technology, it’s too early to talk about mass adaptation. For people who consider that all major activities is conducted in Ethereum network: Etherescan shows 43 146 667 Unique Addresses. Certainly, it’s on 50% more than has Bitcoin blockchain, but we should remember that this number includes: wallets, addresses of smart contracts, tokens etc.
- In spite of the fact that the overall market capitalization is declining, ICO is continue to be on the major parts of collecting money. Token Sales helped to collect more than 20 bln dollars for projects in 2018.
The current status of the Blockchain Ecosystem, September, 2018 (Download a pdf)
Notice: all data were obtained from the public internet resources, you can find links to them in the infographics or below in this article. Alsol, on these resources you can read more about methodology of the collecting these data and check it validity.
References:
- https://coinmarketcap.com/
- https://bitinfocharts.com/ethereum/
- https://www.blockchain.com/charts/my-wallet-n-users
- https://etherscan.io/chart/address
- https://coin.dance/poli
- https://www.coinschedule.com/stats.html
- https://coinmarketcap.com/tokens/
Related infographic: Bitcoin in July 2018
Other blockchain related materials read here


